
-
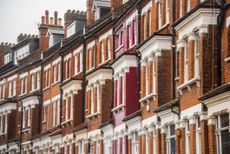
 London house prices: Is the capital's property boom over?
Buyers and investors have always been drawn towards the capital’s property market. But as house prices stall, is the market as lucrative as it once was and are buyers and investors still interested?
-
 Average property values rise for first time in four months - will it last?
UK house prices have increased on a monthly basis for the first time since the outbreak of the Iran war in February but regional differences persist.
-
 8 of the best houses for sale with tennis courts
The best houses for sale with tennis courts – from a 16th-century Warwickshire manor to a Georgian house in the Forest of Dean with a floodlit tennis court.
-
 What’s happening with UK house prices? Latest property forecasts for 2026
With mortgage rates creeping back up and ongoing market volatility, can we expect house prices to slide?
-
 8 of the best properties for sale with home offices
The best properties for sale with home offices – from a Grade I-listed Tudor manor house in Northamptonshire to a garden apartment in London's Belsize Park.
-
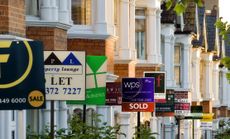
 Rightmove: Asking prices fall in biggest June dip for 14 years as buyer demand remains low
The average asking price for a house fell by 0.6% in June, the biggest fall in the month for 14 years, as buyers were distracted by the May heatwave, Rightmove says.
-
 8 of the best houses for sale with orchards
Houses for sale with orchards – from a West Sussex cottage with apple, quince, cherry and plum trees, to a Passivhaus in Herefordshire with a dining terrace.
-
 Could house prices fall by 5% in 2026?
The Iran war is causing house prices to slide as higher mortgage rates hit buyer confidence. Some experts believe they could fall by as much as 5% in 2026.
-
 Is now a good time to sell a house?
The latest Middle East conflict may dampen demand in the housing market, making it crucial for sellers to be realistic about asking prices to attract interest


